 |

Vol. 1, No. 3- January, 2003
Link to previous issue
|
This newsletter and the Mangrove Biocomplexity project are made possible in part by the National Science Foundation under Grant No. 99-81309. |
|
|
|
|
Networks Hit the Network at Last!
Ulanowitz and Schaler get first drafts where we can see them
|
|
|
|
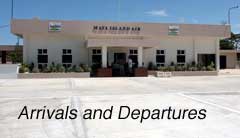
Feller Returns to Country... Immediately Leaves Again |
|
|
Regardless of how much we plan to do when we go to the field, the prize must surely go to Candy Feller. The report on her recent trip - November - came in just as she was going off again at the beginning of January, so it fell to me (an woe be to ye who let that happen) to get it ready for this news letter. Candy's version, complete and unabridged, is behind the Been There Done That icon.
Though Candy often tells us that this project of ours takes place in Florida and Panama as well as Belize, most of us have yet to visit other sites than Twin Cays. Nevertheless, Candy is hard at work setting up the OTS course for this July, field trips from Bocas del Toro to other sites, and a future mangrove/seagrass workshop in Florida. We all need to support that, if for no other reason than the research possibilities opened up by other sites... especially if the future of twinkies is unsettled.
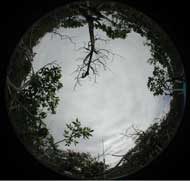
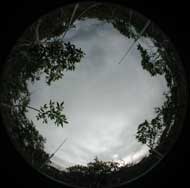
But from the standpoint of an editor looking for a story that sells, Candy also takes the prize with her Coarse Woody Debris study.
She supplied these pictures, showing, first of all, that insects can make a real mess of the trees, but also that they really need our help to clear it out completely. Or maybe I am just saying this because I have always wanted to own a sawzall.
Candy's other big project was measurements of the influence of floc on growth. She has set this up so that some of the trees are enclosed, some aren't. Of course, both are important but some of us may be partial to the FIGLET experiment.
|
|
 |
|
|
|
|
|
And finally, thanks Candy, and everyone who helped, for maintaining the trees in our ecotone experiments. There is no way we could argue half as much about results and collatoral damage if you didn't keep our studies going like this, and I, for one, really appreciate it.
So check out the full report, everyone. |
|
|
|
 Just before Christmas, Bob Ulanowitz and Ursula Schaler put their first network models on the TR server, and encouraged us all to have a look. These were the promised fruit, the product that Bob told us in Louisiana would be there soon. Though they apologized for a delay, they came really close to the target date, in my opinion, and definitely deserve to be congratulated. Just before Christmas, Bob Ulanowitz and Ursula Schaler put their first network models on the TR server, and encouraged us all to have a look. These were the promised fruit, the product that Bob told us in Louisiana would be there soon. Though they apologized for a delay, they came really close to the target date, in my opinion, and definitely deserve to be congratulated.
But when I looked at them the first time, I was, frankly, bewildered. Not that anyone else, looking at my stuff, would be much better off, but for my benefit, and all of us, I asked Bob and Ursula if they would give us hints of what to do with the models and how to look at them.
Ursula came through for us, and here is what she has to say...
"As you already know by now, there are several network data files on the ftp site under 4_Networks. These files are what we have produced thus far in terms of building Twin Cays specific networks (that the networks are not nearly as Twin Cays specific as we would like them to be, you also already know).
What are all these files about? In general, the files describe the data used to build the networks. They say how they were calculated, and they contain the input data for the network analysis.
The information in file TCNetworkDec2002.xls are from the literature and your unpublished data. Here you will find the biomass, consumption (GPP for primary producers), production, egestion, respiration and decay rates (for the non-living compartments) in terms of carbon and nitrogen. The information is there for the fringe, transition and dwarf zones.
This file also contains several metabolic ratios, and flows from and to the surroundings of Twin Cays (atmosphere, sea). The diet composition of each compartment (who eats whom?) was partly based on the literature and partly on the isotope data of Marilyn’s group. Currently there are 49 compartments for the three carbon networks and 50 for the three nitrogen networks.
How did we calculate these data? Check out the Word files FringeC.doc, FringeN.doc, TransitionC.doc, etc…, there are 6 files, one for each network. It is way to complicated to tell you all of it again here, but these docs should be understandable.
How do we make a network out of all these data? Some building blocks are in that file, TCNetworkDec2002.xls – these are the biomass, consumption, respiration, imports and exports and information on ‘who eats whom’. All the nitty gritty data are listed in 6 Excel files (again one for each network) called Fringe-C.xls, Fringe-N.xls, Transition-C.xls, etc….
Don't stop here... keep reading!
|
|
|
|
| Other Stuff - |
Data Management - The Crab Meets the Butterfly ... Over the past month, your editor, has made some progress on issues of data management... the nuts and bolts as well as the theory. Here, I want to let you know some of what we have found. And especially, thanks to Rozalynn Lee for all her help.
|
| Wooller Plans First Twin Cays Extreme Dining Experience ... Matt's latest venture is also a new "sport". Perhaps in warm-up for a Yukon expedition, the next crew at Carrie Bow is in for a treat... |
| Hypocotyl Curvature Fails to Stop the Baby Tree... Update at the end of the Apocrypha story |
|
|
|
|
|
|
| "Sometimes," said Eeyore, "when people have quite finished taking a person's house, there are one or two bits which they don't want and are rather glad for the person to take back, if you know what I mean." -- A. A. Milne |
Contact us |
|
|
|
|
|
|
|
|
|
|
|
|
|
|